Kubernetes v1.37: Native Histograms Graduates to Beta
I'm excited to announce that native histogram support for Kubernetes metrics is graduating to Beta and is enabled by default in Kubernetes v1.37!
Native histograms (previously introduced as Alpha in Kubernetes v1.36 under KEP-5808) bring high-resolution, low-cardinality observability to Kubernetes metrics. By adopting Prometheus Native Histograms, Kubernetes components now expose latency and duration metrics with far greater accuracy while significantly reducing telemetry storage and scraping overhead.
Why move beyond classic histograms?
Since the early days of Kubernetes observability, duration and latency metrics (such as API server request latencies or scheduling durations) have relied on classic Prometheus histograms.
Classic histograms require metric authors to define a static list of cumulative bucket boundaries (le labels), such as 0.005, 0.01, 0.025, 0.05, 0.1, 0.25, 0.5, 1, 2.5, 5, 10. While familiar, this approach introduces three major challenges:
- The Bucket Guessing Game: If a workload's latency profile changes, for example, shifting into microsecond ranges or experiencing long-tail tail latencies beyond the highest bucket, the histogram loses visibility. Specifying bucket boundaries upfront requires knowing the distribution before observing it
- High Cardinality & Storage Cost: With classic histograms, each bucket boundary is exported as a separate time series (
_bucket{le="..."}). A histogram with 10 buckets across multiple labels multiplies the number of time series by 10, increasing memory consumption in Prometheus and inflating time series database (TSDB) storage costs - Interpolation Error in Quantiles: Calculating percentiles using
histogram_quantile()relies on linear interpolation between static bucket boundaries. When bucket spans are coarse, quantile calculations can suffer from significant estimation error
What are Prometheus native histograms?
Prometheus Native Histograms replace static user-defined buckets with dynamic, exponential buckets.
Instead of emitting a separate time series for every single bucket boundary, a native histogram is stored as a single time series containing a rich schema of positive and negative spans, zero thresholds, and exponential scaling factors.
- High Resolution Automatically: Exponential buckets dynamically adjust to any value range — from nanoseconds to hours — without requiring pre-configured bucket boundaries
- Up to 90% Fewer Time Series: By consolidating buckets into structured spans within a single time series, scraping and storage overhead are dramatically reduced
- Accurate Quantile Calculation: Quantiles can be calculated with mathematical bounds on error (≃5% worst-case relative error under default settings) across the entire spectrum of observations
How native histograms work in Kubernetes
In Kubernetes, native histogram support is implemented directly inside the shared metrics subsystem (k8s.io/component-base/metrics).
Figure 1 illustrates how native histogram metrics are processed and exposed across Kubernetes components.
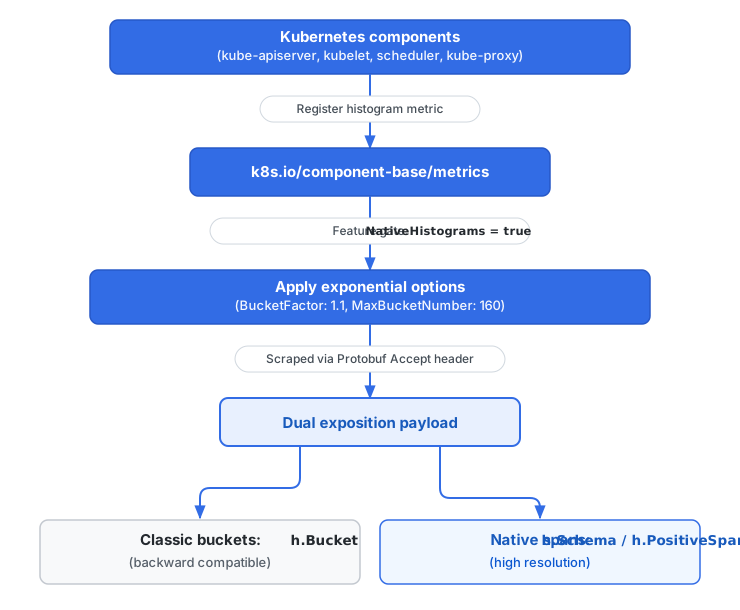
Figure 1. Native histogram processing and dual exposition flow in Kubernetes.
1. Dual exposition for zero breaking changes
A primary design requirement for KEP-5808 was zero disruption for existing observability stacks. When the NativeHistograms feature gate is enabled, Kubernetes components use dual exposition:
- Classic buckets (
h.Bucket) are still emitted alongside native spans. Existing Prometheus servers, dashboards, and alerting rules that rely on traditional text scraping or classic bucket labels continue to work unmodified - Native spans (
h.Schema,h.PositiveSpan) are included in the same Protobuf payload for collectors that understand native histograms
2. Tuned default exponential configuration
When NativeHistograms is enabled, the k8s.io/component-base/metrics package automatically applies standardized exponential options to all histogram metrics:
BucketFactor: 1.1: Configures exponential buckets where each bucket is at most 10% wider than the preceding one. This guarantees a mathematically bounded worst-case relative error of at most ~5% for quantile calculations regardless of whether an operation takes 1 millisecond or 10 seconds.MaxBucketNumber: 160: Caps the maximum number of buckets per histogram to 160. Following OpenTelemetry SDK recommendations for base-2 exponential histogram aggregation, this limit protects component memory usage even under extreme outlier distributions.
3. Broad component support
Because native histograms are integrated into component-base/metrics, all major Kubernetes control plane and node components inherit support automatically, including:
kube-apiserver(e.g.,apiserver_request_duration_seconds, authentication/authorization metrics, validation latencies)kube-scheduler(e.g.,scheduler_plugin_execution_duration_seconds,scheduler_scheduling_algorithm_duration_seconds)kubelet(node-level container runtime and pod lifecycle metrics)kube-controller-managerandkube-proxy
How to scrape native histograms
The simple answer: upgrade to Kubernetes v1.37, and it works.
Because Kubernetes v1.37 enables NativeHistograms by default, your cluster is already emitting dual-exposition metrics. How you configure Prometheus to scrape native histograms depends on your Prometheus version:
1. Prometheus scrape configuration by version
-
Prometheus 3.0+ (Recommended): Use explicit per-job configuration in your
scrape_configsrather than global flags (the global--enable-feature=native-histogramsflag is deprecated in Prometheus 3.9+):scrape_configs: - job_name: 'kubernetes-apiservers' scrape_native_histograms: true always_scrape_classic_histograms: true # Recommended during transitionYou must read the caution in Migrating dashboards and alerts in the Native Histograms documentation. In summary: always set
always_scrape_classic_histograms: trueduring your transition period. Without this setting, Prometheus will only ingest the native format and stop ingesting classic_bucket,_count, and_sumseries. Settingalways_scrape_classic_histograms: trueensures existing dashboards (histogram_quantile(..._bucket...)) and alerts continue to work while you migrate them to native histograms. -
Prometheus 2.40 – 2.x: Enable Native Histograms globally by starting Prometheus with the feature flag:
prometheus --enable-feature=native-histogramsNote that in Prometheus 2.x, this is an all-or-nothing setting for all scrape targets.
2. Verify Protobuf dual exposition
Standard Prometheus text scraping (application/openmetrics-text or plain text format) only transfers classic buckets. When scrape_native_histograms is enabled, Prometheus automatically negotiates Protobuf format with Kubernetes endpoints.
You can verify that a Kubernetes component is exporting native histograms using curl with an Accept header specifying Protobuf. For example:
## THIS IS NOT SECURE. ONLY DO THIS IN A TEST CONTEXT.
curl --insecure \
  -H "Accept: application/vnd.google.protobuf;proto=io.prometheus.client.MetricFamily;encoding=delimited" \
  --header "Authorization: Bearer $(cat /var/run/secrets/kubernetes.io/serviceaccount/token)" \
  https://localhost:6443/metrics
When decoded, the returned MetricFamily for histogram metrics (like apiserver_request_duration_seconds) will contain both traditional bucket entries and populated schema / positive_span fields.
Querying native histograms in PromQL
Once native histograms are ingested into Prometheus, you can query them using standard PromQL histogram functions without needing static le bucket labels or _bucket suffixes:
# 1. Calculating P99 latency for a single target:
# Classic histogram (requires _bucket suffix):
histogram_quantile(0.99, rate(apiserver_request_duration_seconds_bucket[5m]))

# Native histogram (operates directly on the metric name):
histogram_quantile(0.99, rate(apiserver_request_duration_seconds[5m]))

# 2. Aggregating across multiple instances (e.g., all API servers):
# Classic histogram (requires sum by (le) to preserve bucket boundaries):
histogram_quantile(0.99, sum by (le) (rate(apiserver_request_duration_seconds_bucket[5m])))

# Native histogram (no grouping by le required!):
histogram_quantile(0.99, sum(rate(apiserver_request_duration_seconds[5m])))
With native histograms, functions like histogram_quantile() operate directly on the dynamic exponential spans inside the time series, producing highly accurate quantiles without static bucket interpolation error.
For official documentation on querying Native Histograms in PromQL, see:
- PromQL
histogram_quantiledocumentation - PromQL
histogram_fractiondocumentation - PromQL
histogram_sumdocumentation - PromQL
histogram_countdocumentation - PromQL
histogram_countdocumentation - PromQL
histogram_stddevandhistogram_stdvardocumentation
Dashboard migration & rollback strategy
Recommended migration workflow
To safely transition your monitoring infrastructure to Native Histograms without breaking existing alerts or dashboards, I recommend a four-step migration workflow:
- Enable Both Formats: In your Prometheus 3.x scrape config, set
scrape_native_histograms: trueANDalways_scrape_classic_histograms: trueso both formats are collected safely during transition - Migrate Queries: Update your Grafana dashboards and Prometheus alerting rules from classic quantile queries (
histogram_quantile(..._bucket...)) to native histogram queries (histogram_quantile(...)), and replace references to classic_countand_sumseries withhistogram_count(...)andhistogram_sum(...) - Verify in Staging/Production: Validate that all dashboards and SLO alerts fire and graph correctly using the new native histogram queries
- Unlock ~10x Storage Savings: Once migration is complete, set
always_scrape_classic_histograms: false. Prometheus will stop ingesting the static_bucket,_count, and_sumtime series, reducing your histogram time series count by up to 90%!
Opt-out and rollback flexibility
Because native histograms are dual-exposed, using them is entirely opt-in from a collector perspective:
- Instant Collector Rollback: If you need to stop ingesting native histograms, simply set
scrape_native_histograms: falsein your Prometheus job configuration. No Kubernetes restart is required, and Prometheus will immediately resume scraping only the classic format without data loss - Component Feature Gate Rollback: Administrators can also disable the feature gate on Kubernetes components using
--feature-gates=NativeHistograms=false(requires component restart)
What's next & how to get involved
As native histograms progress toward General Availability (GA) in future Kubernetes releases, SIG Instrumentation will continue evaluating ecosystem readiness, performance characteristics, and long-term plans for eventually deprecating static classic buckets once native histogram adoption becomes ubiquitous across the monitoring community.
- Read the KEP-5808 page or the KEP GitHub issue to learn more.
- Read the Prometheus Native Histograms specification and PromQL querying functions documentation
- Get involved with SIG Instrumentation on Slack in #sig-instrumentation or join the weekly SIG meetings
Acknowledgements
A huge thank you to contributors across SIG Instrumentation and component owners who collaborated on the design, implementation, testing, and review of native histograms in Kubernetes!